Monitoring with Prometheus & Grafana
Prometheus
Prometheus is an open-source systems monitoring and alerting toolkit originally built at SoundCloud.
Prometheus’s main features are:
- A multi-dimensional data model with time series data identified by metric name and key/value pairs
- PromQL, a flexible query language to leverage this dimensionality
- Time-series Database to store all the metrics data
- A simple user interface where you can visualize, query, and monitor all the metrics
Grafana
Grafana allows you to bring from various data sources like Elasticsearch, Prometheus, Graphite, InfluxDb, etc, and visualize them with beautiful graphs.
It also lets you set alert rules based on your metrics data. When an alert changes state, It can notify you over mail, slack, or various other channels.
Publishing metrics in Spring Boot with Micrometer
Micrometer provides a simple facade to integrate actuator metrics with external monitoring systems and it allows us to instrument your JVM-based application.
Publishing metrics in Spring Boot Application
We will do the following steps-
Step 1: Configure Spring Boot Actuator to enable metrics
Step 2: Configure Prometheus to scrape the metrics
Step 3: Visualize the metrics in a Grafana Dashboard
Step 4: Add Custom Metrics to the application
Step 1: Configure Spring Boot Actuator to enable metrics
First of all, we will make a spring boot application with the following dependencies:
implementation 'org.springframework.boot:spring-boot-starter-actuator'
implementation 'org.springframework.boot:spring-boot-starter-web'
runtimeOnly 'io.micrometer:micrometer-registry-prometheus'
And then we need to expose some endpoints in the application.yaml:
spring:
  application:
    name: spring-micrometer-prometheus
endpoint:
  uri-prefix: /rms-app-bff
management:
  endpoints:
    web:
      exposure:
        include: [ "health","prometheus", "metrics" ]
  endpoint:
    health:
      show-details: always
    metrics:
      enabled: true
    prometheus:
      enabled: true
server:
  port: 8080
And then we can run the application & verify that actuator endpoints expose successfully by hitting http://localhost:8080/actuator in the browser & will get the below response.
{
    "_links": {
        "self": {
            "href": "http://localhost:8080/actuator",
            "templated": false
        },
        "health": {
            "href": "http://localhost:8080/actuator/health",
            "templated": false
        },
        "health-path": {
            "href": "http://localhost:8080/actuator/health/{*path}",
            "templated": true
        },
        "prometheus": {
            "href": "http://localhost:8080/actuator/prometheus",
            "templated": false
        },
        "metrics-requiredMetricName": {
            "href": "http://localhost:8080/actuator/metrics/{requiredMetricName}",
            "templated": true
        },
        "metrics": {
            "href": "http://localhost:8080/actuator/metrics",
            "templated": false
        }
    }
}
And we can also check actuator metrics by hitting http://localhost:8080/actuator/prometheus & get many metrics data that is exposed from the application.
Step 2: Configure Prometheus to scrape the metrics
Create a configuration file for Prometheus named Prometheus. yaml
global:
  scrape_interval:     15s # Default is every 1 minute.
  evaluation_interval: 15s # Evaluate rules every 15 seconds. The default is every 1 minute.

rule_files:
# - "first_rules.yml"
# - "second_rules.yml"

# A scrape configuration containing exactly one endpoint to scrape:
scrape_configs:
  - job_name: 'prometheus'

    static_configs:
      - targets: ['127.0.0.1:9090']

  - job_name: 'spring-actuator'
    metrics_path: '/actuator/prometheus'
    scrape_interval: 5s
    static_configs:
      - targets: ['SYSTEM_IP_ADDRESS:8080'] # refer system ip address rather that localhost
Here we have to replace SYSTEM_IP_ADDRESS with the local PC’s IP address.
Create a Prometheus Docker file including the above Prometheus configuration.
FROM prom/prometheus
ADD prometheus.yml /etc/prometheus/
Build a docker image & run in the 9090 port.
docker build -t my-prometheus .
docker run -d --name prometheus -p 9090:9090 my-prometheus
After running Prometheus, we can get the Prometheus dashboard by calling http://localhost:9090/ url.

Step 3: Visualize the metrics in a Grafana Dashboard
Run Grafana docker by using the below command:
docker run -d --name=my-grafana -p 3000:3000 grafana/grafanaAfter running Grafana we can access Grafana by browsing http://localhost:3000/ . In the login form, we have to input a user/password, the default user/password is admin/admin. After login we can see the home page of the Grafana board.

Then we have to add data sources. We will add Prometheus & add the Prometheus URL.

After successfully added, we can create a dashboard.

We can create multiple dashboards by using the default metrics

Step 4: Add Custom Metrics to the application
If we need to add custom metrics, we will first configure the bean of MeterRegistry. By default, Spring Boot applications are Autowired with SimpleMeterRegistry. In this example, we define the configuration to create a CompositeMeterRegistry: MicrometerConfiguration.java
import org.springframework.context.annotation.Bean;
import org.springframework.context.annotation.Configuration;
import io.micrometer.core.instrument.MeterRegistry;
import io.micrometer.core.instrument.composite.CompositeMeterRegistry;

@Configuration
public class MicrometerConfiguration {
    @Bean
    public MeterRegistry getMeterRegistry() {
        return new CompositeMeterRegistry();
    }
}
And We have to implement in the controller or service like below:
    private final MeterRegistry meterRegistry;
    private AtomicInteger activeUsers = new AtomicInteger(0);

    public SpringMicrometerPrometheusApplication(MeterRegistry meterRegistry) {
        this.meterRegistry = meterRegistry;
    }

    @GetMapping("/hello")
    public Map<String, String> hello() {
        Map<String, String> response = new HashMap<>();
        Random random = new Random();
        activeUsers.set(random.nextInt(1000));
        response.put("message", "active User " +  activeUsers);
        meterRegistry.gauge("number.of.active.users", activeUsers);
        return response;
    }
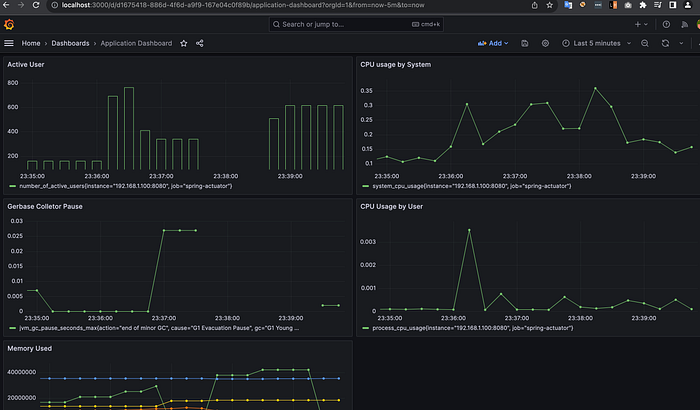
And if we add active user dashboard it will shown like below

Full source code: https://github.com/KickSky/spring-micrometer-prometheus
Reference:
